Design Award - Winners, is a platform dedicated to featuring good design from all countries.
Office Furniture Design Flow 360 Ergonomic Chair by UE FURNITURE CO.,LTD
Prosumer Products and Workshop Equipment Design Mars 5 Ultra Resin 3D Printer by Shenzhen Elegoo Technology Co., Ltd.
Prosumer Products and Workshop Equipment Design Elegoo Centauri Carbon 3D Printer by Shenzhen Elegoo Technology Co., Ltd.
Office Furniture Design T6 Intelligent Chair by Huiping Luo
Yacht and Marine Vessels Design Hermes Yacht by Paolo Demel
Textile, Fabric, Textures, Patterns and Cloth Design Fenc Thermobionic Bionic Knitting Fabrics by Far Eastern New Century Corporation
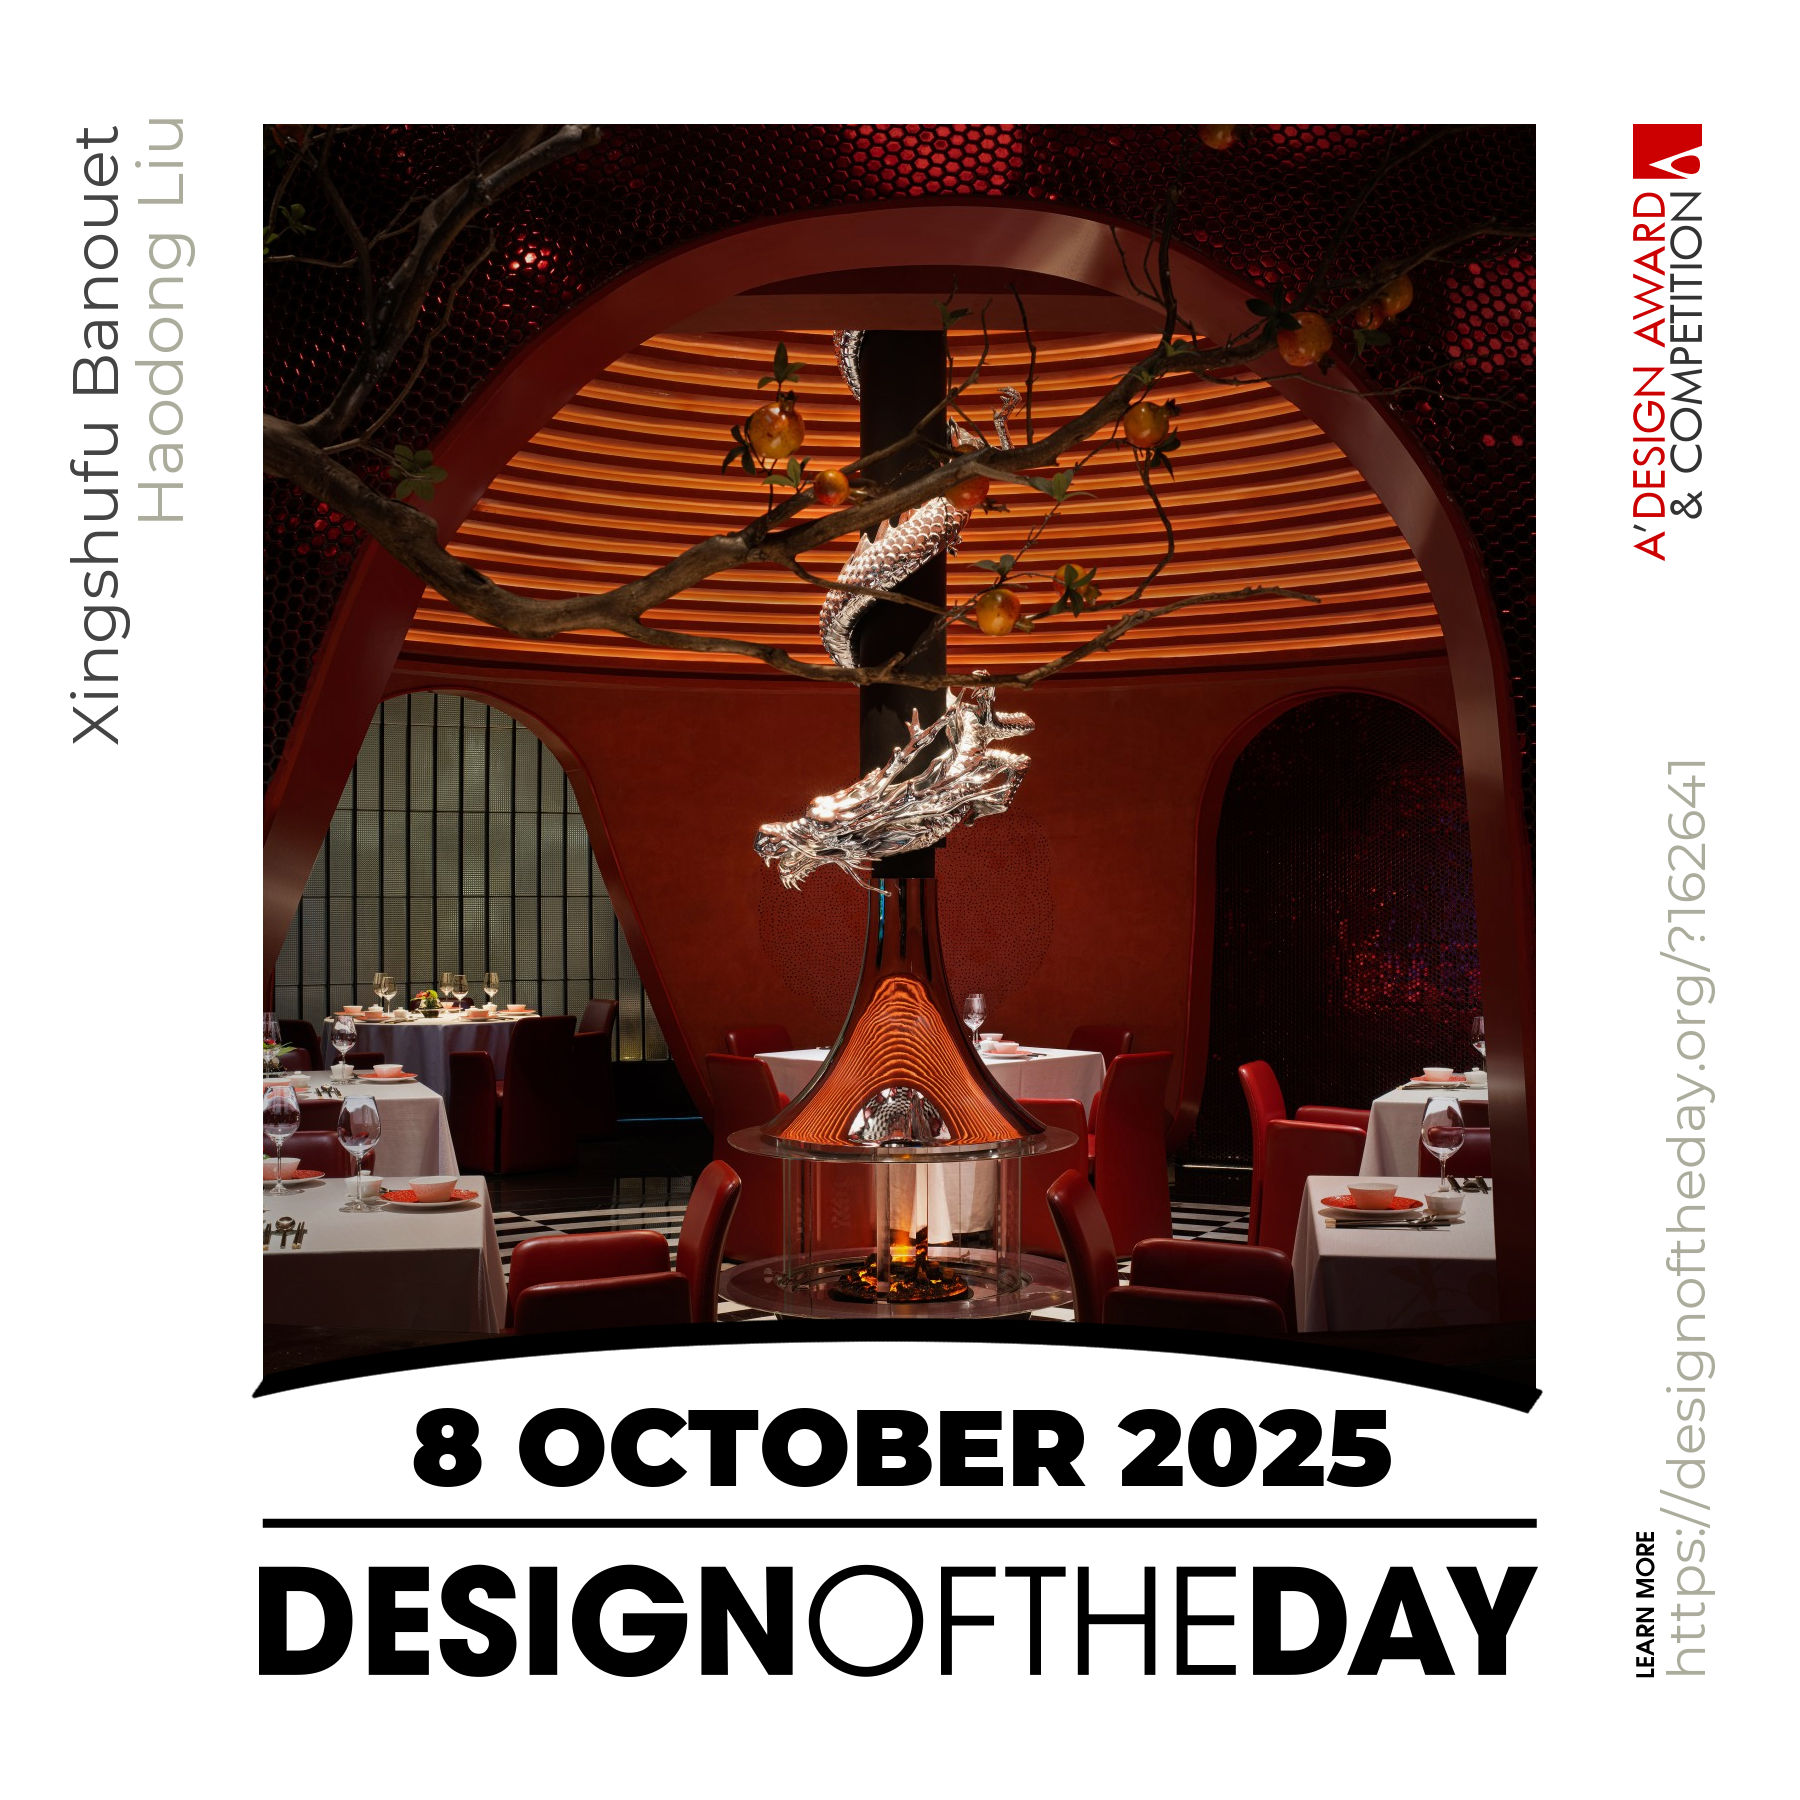
Design of the Day A' Design Award & Competition is pleased to present you with the Design of the Day, an excellent example of good design that makes a positive change. View the Design of the Day showcase to see previously featured good design works today.
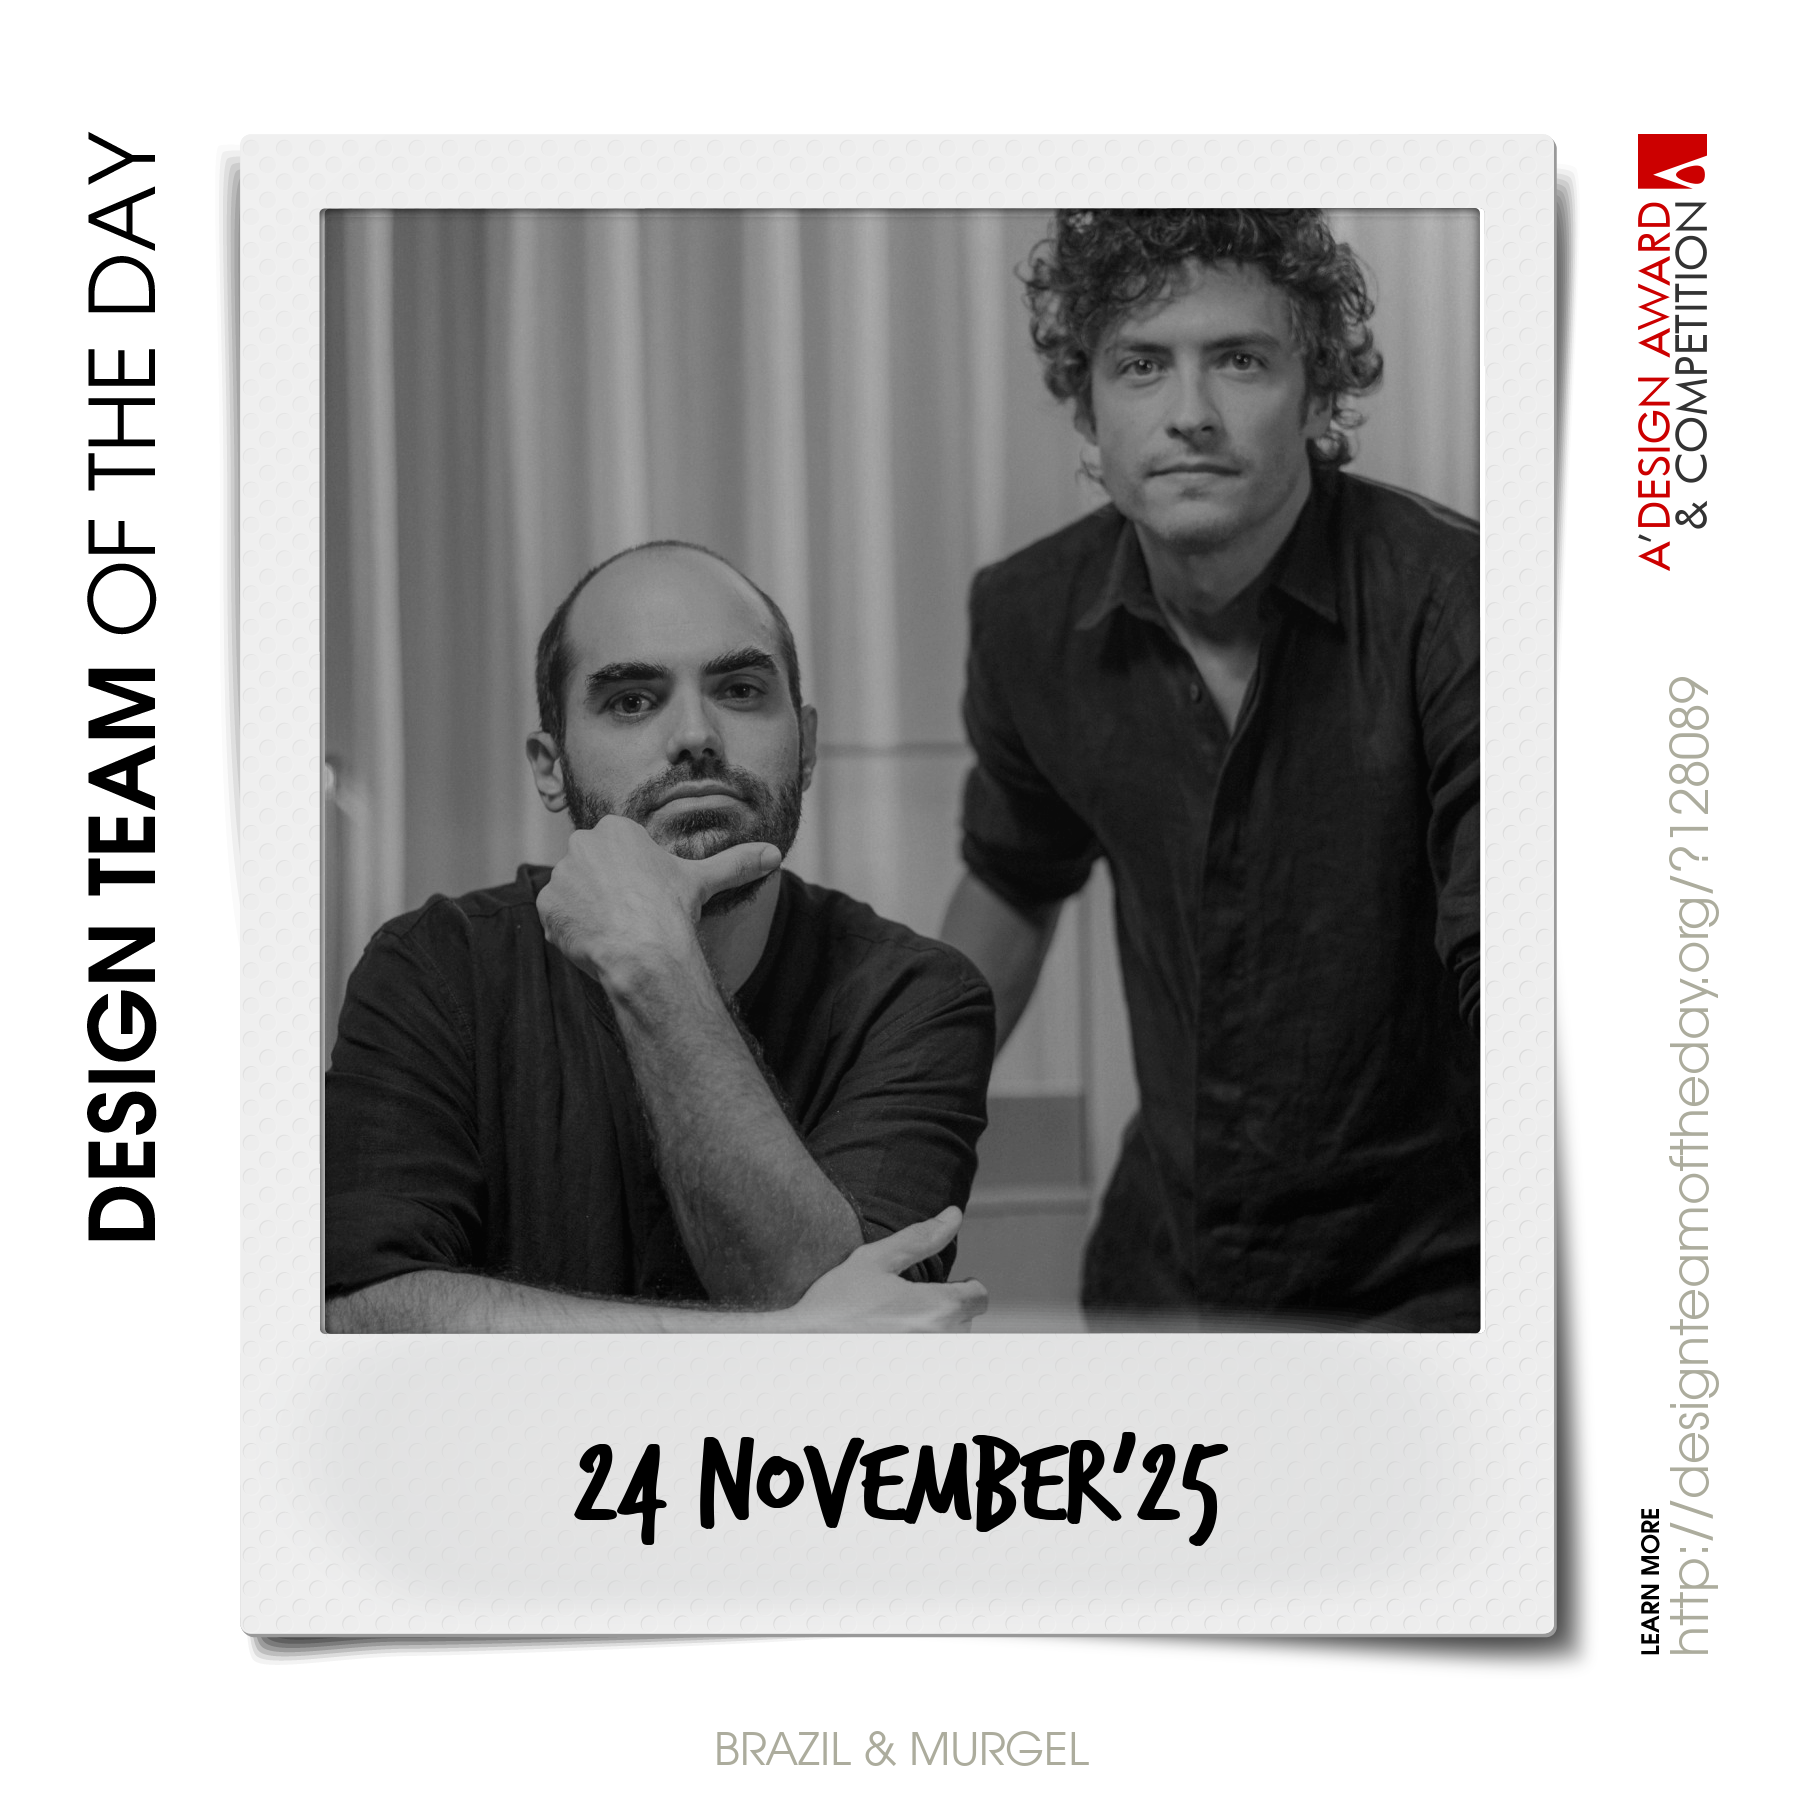
Design Team of the Day A' Design Award & Competition is pleased to present you with the Design Team of the Day, an outstanding design team that makes the World a better place with their good designs. View the Design Team of the Day showcase to see previously featured design teams today.
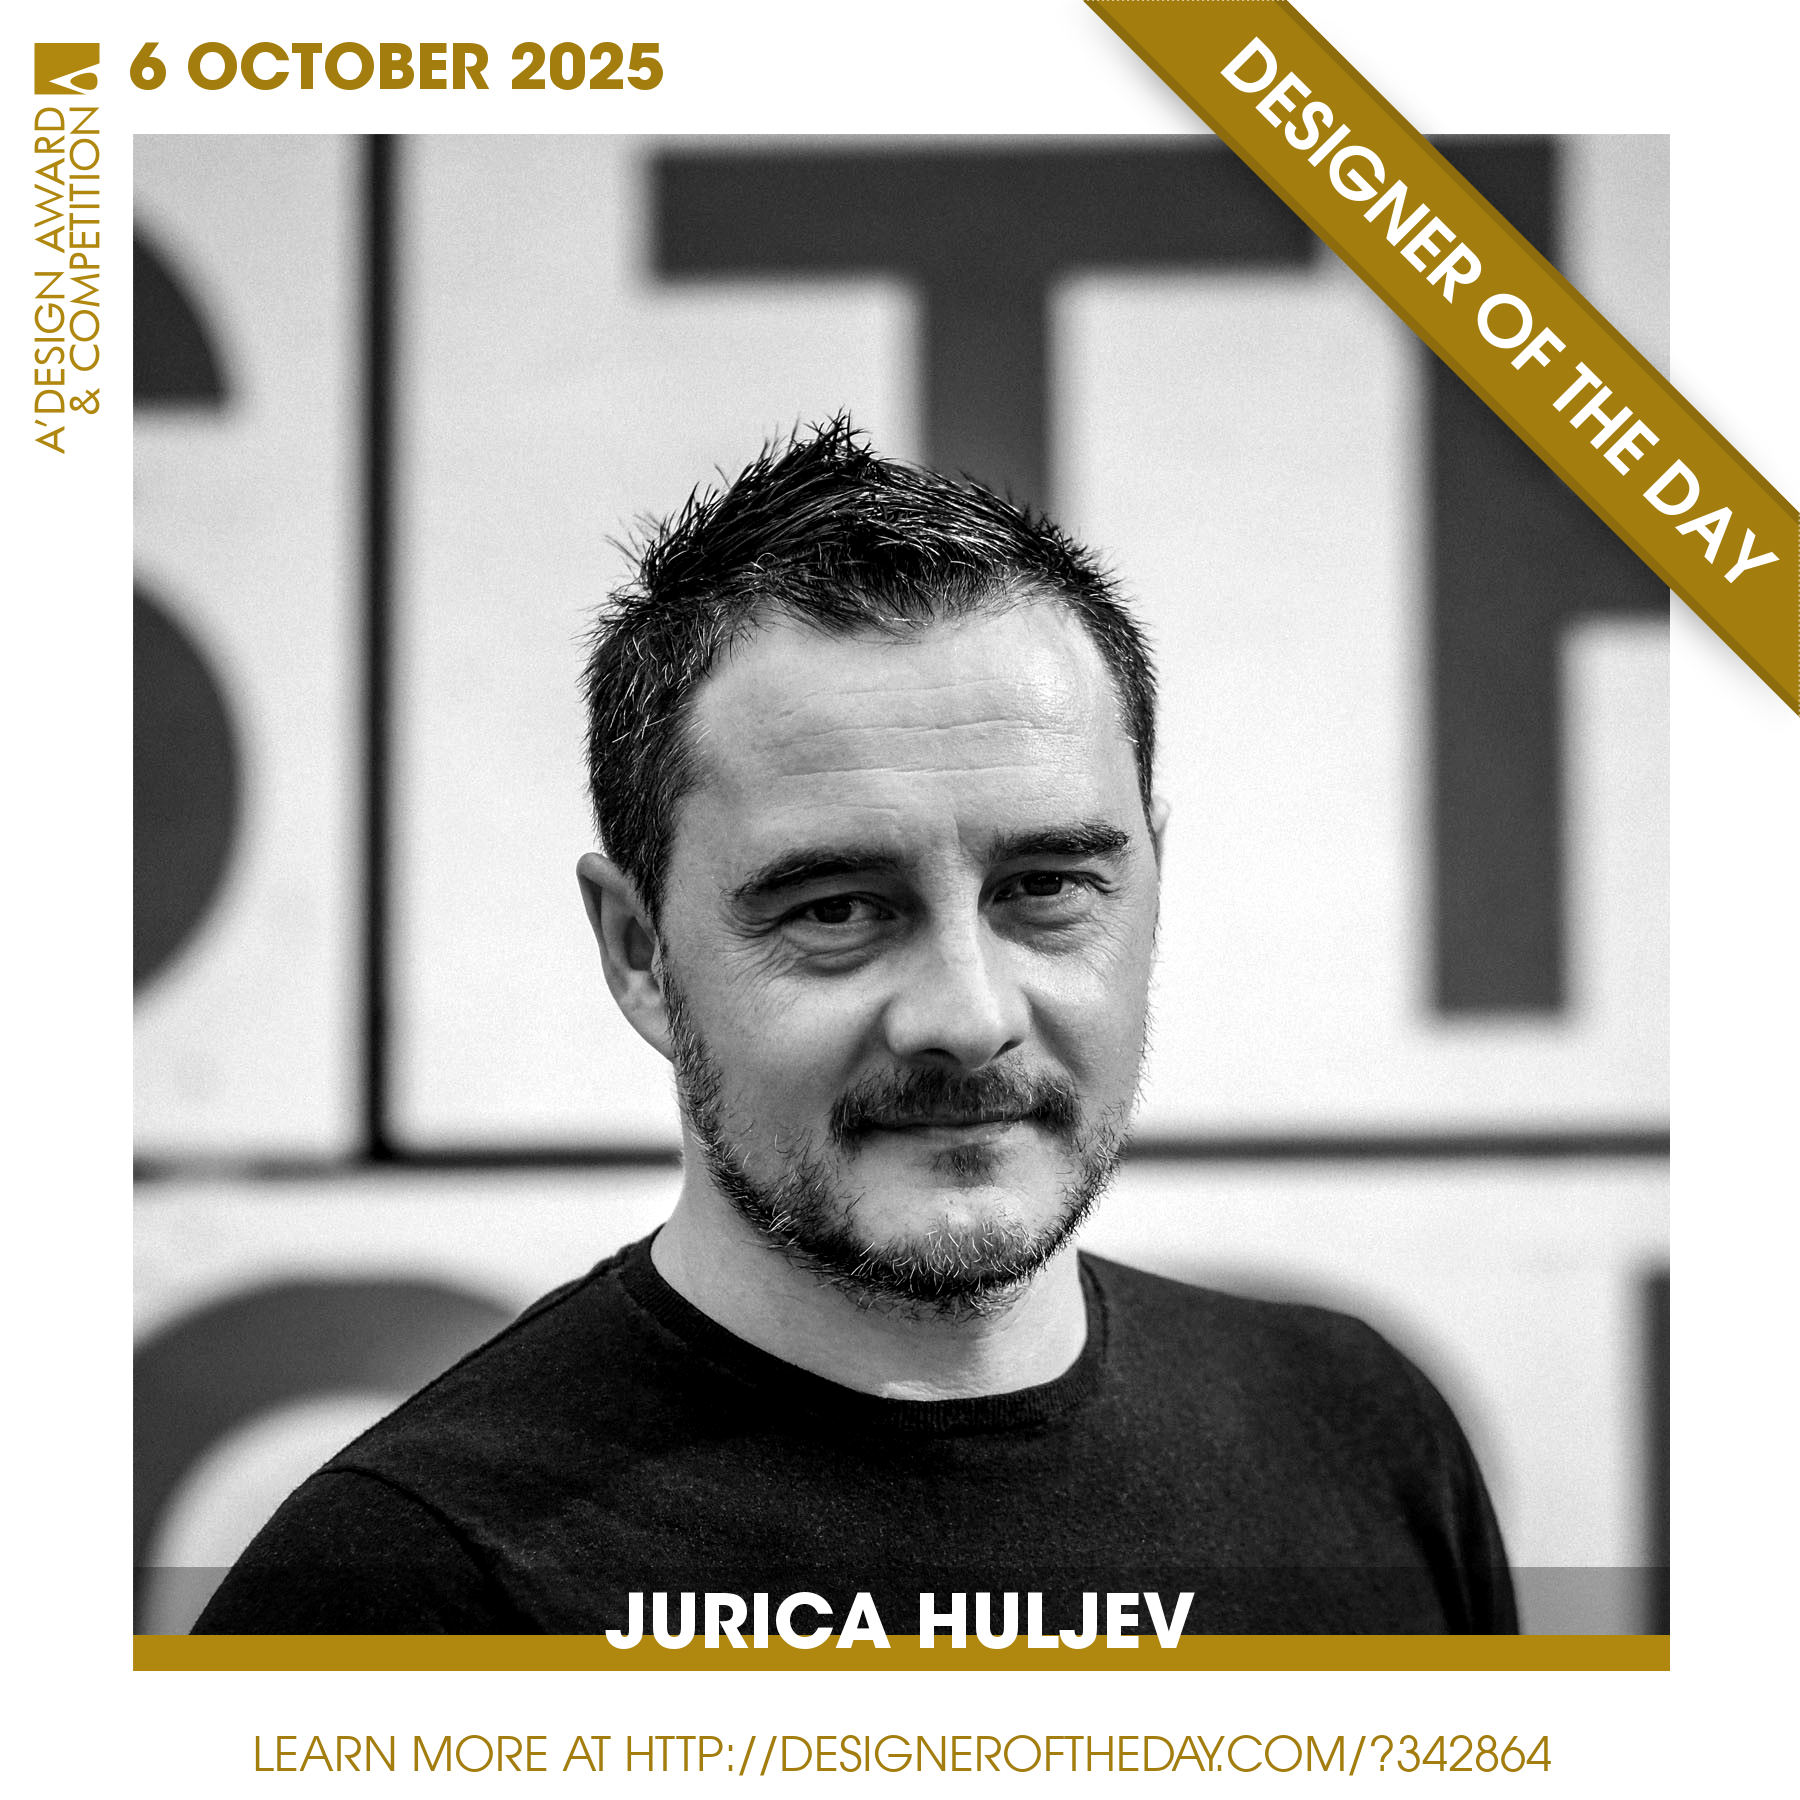
Designer of the Day A' Design Award & Competition is pleased to present you with the Designer of the Day, an outstanding and extraordinary designer that advances society with their good design. View the Designer of the Day showcase to see previously featured designers today.
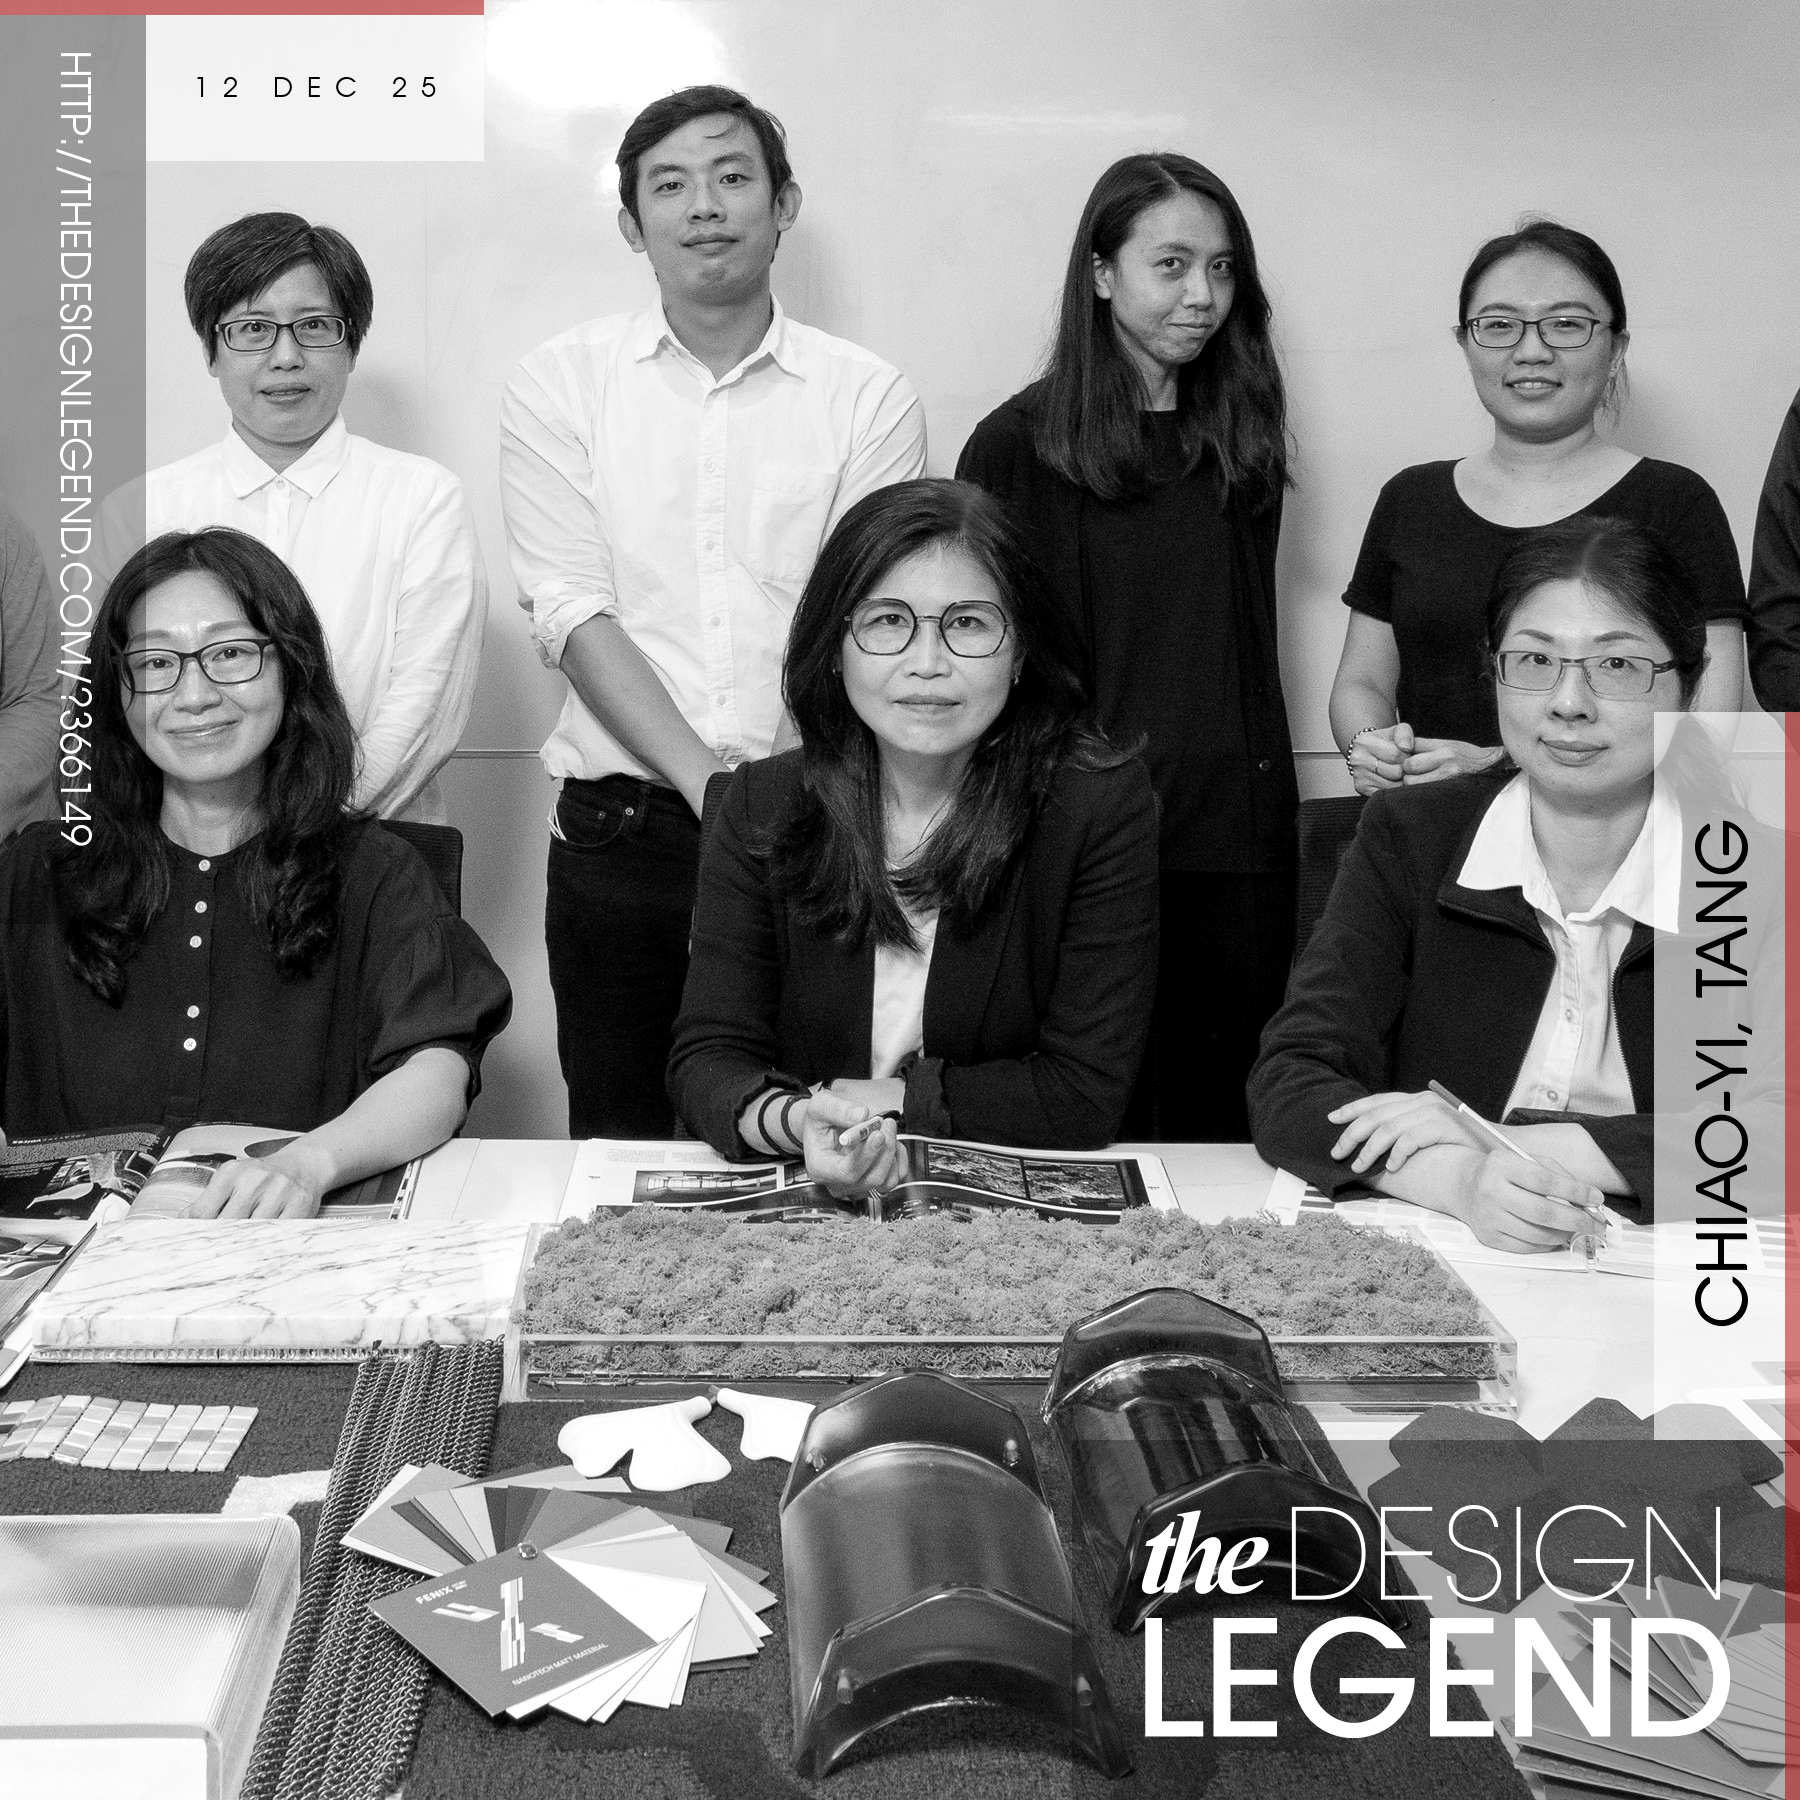
Design Legend of the Day A' Design Award & Competition is pleased to present you with the Design Legend of the Day, a true design legend that changes the world with their exceptional design work. View the Design Legend of the Day showcase to see previously featured design legends today.

Design Interview of the Day A' Design Award & Competition is pleased to present you with the Design Interview of the Day, an amazing interview about an excellent design work. View the Design Interview of the Day showcase to see previously featured design interviews today.
Designer Highlight of the Day A' Design Award & Competition is pleased to present you with the Designer Highlight of the Day, an excellent designer with outstanding design works. View the Design Highlight of the Day showcase to see previously featured designers today.
Graphics, Illustration and Visual Communication Design Culture to Technology Identity Placard by Lei Wang
Office Furniture Design Birch Office Chair by JE Furniture Co., Ltd Goodtone Branch
Graphics, Illustration and Visual Communication Design B. League All-Star Game 2023 Op Art by SonyMusic Solutions inc.
Yacht and Marine Vessels Design Kai Smart Hybrid Motoryacht by BAZ Yacht Design
Yacht and Marine Vessels Design Project Nazare Sailing Yacht by Onur Kiren
Mobile Technologies, Applications and Software Design MyJCB Credit Card App by JCB Co., Ltd
Mobile Technologies, Applications and Software Design Sharge Private EV Charging Pile Sharing APP by Fang Xu, Xuan Shen, Yongwen Dai
Yacht and Marine Vessels Design 37XP Maya Private Yatch by REZZAN BENARDETE
Graphics, Illustration and Visual Communication Design Guangzhou Academy of Fine Arts Exhibition Visual Identity by CHUNSHENG SHI
Office Furniture Design Humanenergy E5 Ergonomic Chair by Guangzhou Pure Faith Technology Co., Ltd.
Graphics, Illustration and Visual Communication Design Aisling Sans Typeface by Paul Robb
Mobile Technologies, Applications and Software Design Conexion Mobile Application by Ziwei Song
Outdoor Gear and Camping Equipment Design Wormy Compact Fishing Systems by Szabolcs Nemeth
Graphics, Illustration and Visual Communication Design Kakao AI Campus Brand Design by Jangsoon Choe
Textile, Fabric, Textures, Patterns and Cloth Design Fenc Loopflex Spandex Free Stretch Fabric by Far Eastern New Century Corporation
Yacht and Marine Vessels Design One 16 Hybrid Jetski Boat by Amor Jimenez Chito
Graphics, Illustration and Visual Communication Design All Things Meet Illustration by Guo Kaixuan
Toys, Games and Hobby Products Design Project XYLO Midi Device by Kevin Yang
Graphics, Illustration and Visual Communication Design Infinite Borders Reshape The Three Kingdoms Brand by TzuYin Weng
Graphics, Illustration and Visual Communication Design La Plage Brand Identity by Ebru Sile Goksel
Outdoor Gear and Camping Equipment Design Camp Napper Portable Camping Pillow by sxdesign
Graphics, Illustration and Visual Communication Design Ancora Brand Identity by Keiichiro Yanagi
Graphics, Illustration and Visual Communication Design Lalique Wall Calendar by David Kantor
Food, Beverage and Culinary Arts Design Freshmore Food by Yang Liao
Graphics, Illustration and Visual Communication Design Dotline Corporate Identity by Tomohiro Kaji
Graphics, Illustration and Visual Communication Design Sabbioni Branding Promotional Branding by Paul Robb
Prosumer Products and Workshop Equipment Design Saturn 4 Ultra UV Photocuring 3D Printer by Zhineng Pai
Graphics, Illustration and Visual Communication Design SUMMER PALACE TOUR Brand Design by Beijing Jiaotong University
Graphics, Illustration and Visual Communication Design Terra Branding by Akihito Shimizu
Graphics, Illustration and Visual Communication Design Better Bodies Hi Brand Identity by Takahiro Eto

World Design Rankings World Design Rankings ranks all countries and designers, brands and architects within these countries based on the number of design awards won globally. Discover World's leading design countries, designers, artists and architects at WDR today.
Designers.org Designers.org features the World's leading designers, artists, architects, engineers, creative agencies, photographers, illustrators, and makers. Visit Designers.org to discover profiles and portfolio of award-winning designers from across the globe.
A' Design Award A' Design Award & Competition is a peer-reviewed, juried, blind-voted, international, prestigious design accolade that aims to create awareness and appreciation for good design worldwide. Nominate your good design for award consideration today.